Category Archives: AHP

The New Fundraising Calendar: NOW!

Consumer experiences shape much of our constituents’ fundraising lens. For example, I’ve written extensively about the #iPhoneProblem. This “problem” doesn’t mean iPhones are bad; to the contrary, they are so good our nonprofit tools simply can’t keep pace with users’ expectations (see our recent technology satisfaction survey for details: https://goo.gl/M1PIy5). This spreads to issues like use and reliance on mobile functions, which are creeping up the charts for donor giving preferences, for example. All of this consumer experience impact increasingly affects how we plan, schedule, and execute our fundraising strategies.

One need look no further than “Giving Tuesday” (i.e., philanthropy’s response to “Black Friday” and “Small Business Saturday” gimmicks) to see how our strategies and calendaring are being shaped. Giving Day efforts by universities (which I appreciate, for the record) feel a little like GroupOn specials. The provenance of GoFundMe pages is becoming harder to discern….am I giving to my alma mater or some guy at my alma mater? Overall, urgency and immediacy are prime objectives in this new approach. “Act now, before it’s too late!”

An interesting article in the Atlantic (https://goo.gl/jRfajb) assesses the impact of constant marketing to prospective students. For fundraising, the trend is similar. The days of a year-long direct response calendar are numbered. 24/7/365 strategies like peer-to-peer efforts are starting to look as if they can outstrip time-honored phonathon efforts. For example, one university’s recent Giving Day resulted in 1,800 new donors among the 12,000+ donors to that effort, totals that far surpassed the more tedious phonathon efforts to date.

So, what does this mean for nonprofits? For starters, rather than that year-end pitch to all of your constituents, more and more immediate solicitations (ideally conducted by peers, such as alumni reunion classmates) are to be expected.

As this GivingUSA chart suggests, giving is remarkably stable and generally finite and therefore nonprofits must try their best to get as much of the pie as possible. Now! That year-end big mailing? Do it sooner. That email communication plan? Start it today. That reunion fundraising effort? Get it moving. Don’t have a good peer-to-peer tool? Get one, fast!

Some of this is hyperbolic, of course, yet the message should be clear. If your fundraising schedule calls for raising most of your money with calendar and fiscal year-end pushes, by the time you reach many of your prospective donors, they will have already given….just not to your organization.

3 Critical Concerns with Cost Per Dollar Raised (CP$R)

ProductivityProductivity is vitally important to nonprofits but none of us in the social sector are able to spend enough time, energy, and…well…dollars on being productive. Instead, for decades, we have been more focused on efficiency at the expense of effectiveness and impact. We stuff envelopes at night to save money, then lose overworked staff for a 5% pay increase at a nonprofit in town. Our boards embrace online innovation but funding is often on a shoestring budget. Some great studies and presentations have highlighted some of the drivers for this. After years studying this dilemma, I submit that the over-reliance on and misapplication of the “cost per dollar raised” (CP$R) metric is the clearest example of this problem. While we want to raise more, we penalize ourselves if we invest too much.

The industry needs to change and here are three critical concerns with CP$R and its sometimes negative effect our industry:

  1. Growth: Fundraising is a long-term endeavor. Expanding fundraising results takes time, consistent marketing and messaging, and investment. The current industry emphasis on CP$R diminishes the ability to weather a tough year, offset a big gift’s impact in year-over-year evaluation, or properly fund our efforts. Organizations whose strategies rightly focus on major and principal giving are particularly vulnerable to scrutiny over CP$R issues depending on the timing of a big, strategically cultivated gift.
  2. Staffing: The professionalization of fundraising is changing the math on what is reasonable for budgets. Most nonprofits will spend about 65% of their operational fundraising budget on staff and benefits. Low CP$R targets, though, mean that we may not have enough to invest once/if we get the right people on place as this mix relies heavily on the typically market-depressed salary bases provided to fundraising professionals. We might secure top talent committed to our missions, but instead we seem to experience a costly turnover rate and stunt our fundraising efforts in the process.
  3. Infrastructure: I’ve written about the “iPhone” problem–that is, people’s expectations for work-related technology and processes are shaped by their consumer experiences using tools and apps designed by the world’s biggest companies. The result is “relative deprivation”; we want from our fundraising tools what we get from our consumer products. Unfortunately, collectively, our industry simply doesn’t generate enough demand for vendors to supply tools that match our consumer experiences. Imagine if we were empowered to demand better tools that could be shown to increase our bottomline, even if we would sometimes eclipse the currently-too-low CP$R thresholds. Imagine if we could invest an extra $0.01-per-$1.00 raised or so each year as an industry. That would be a great start.

Our industry’s efficiency mantra can be overwhelming. Funders’ expectations to deliver more with less are difficult to manage. The nature of fundraising efforts, while akin to sales, is different in its non-transactional nature. Nonprofits are directed to invest less than for-profits. And, our industry’s focus on CP$R is a root cause of our challenges.

Alternatives and Additions

While CP$R is a common measure of nonprofit evaluation, there are important alternatives to CP$R. These can be taken in conjunction with costs to present a more balanced, nuanced evaluation of the effectiveness of a nonprofit.

  • Raised per Full Time Employee/Equivalent (FTE). I’ve written at length about the value of measuring “Dollars Raised per FTE.” It is a surrogate for CP$R in some ways, but it gets at a better way to position productivity and effectiveness. Study after study shows that nonprofits raising $1 million per FTE in fundraising are performing in the top quartile. Would you rather raise more by adding more people, or save money at the risk of losing people?
  • Net Gain: Imagine this scenario—you can net $10 million or $20 million in a year, but the former costs you $2 million and the latter costs you $10 million. $20 million beats $10 million, right? Not if it costs “too much” to generate. We need to be able to choose the latter but our industry, through charity watchdogs and other traditions, rewards spending less even if you provide less to your cause. There is a balance needed here. Different organization types at different stages of growth, staffing, and infrastructure require a nuanced evaluation.
  • Impact of Dollars Raised: Recent innovations by groups like GiveWell reinforce the value in looking at what was accomplished because of the funding generated by fundraising. Can more kids experience an open MRI that donors’ contributions helped fund? Can a community see a decline in diabetes because of charitably funded education efforts? These are organization-specific so don’t lend themselves to a nice, simple number, but the current reliance on CP$R too often results in overly simplistic evaluations.

Moving forward with new measures will take guts. We need to push back against the myopic focus on annual CP$R. We need to seek investment in infrastructure and technology in line with expectations of those who sit on our boards. We need to fervently battle to retain talented staff by properly funding roles. We need to clearly define the terms of the debate so definitions like “raised” retain their fundraising meaning and are not reduced to more simplistic notions defined on a general ledger. And, most importantly, we need a message that reminds our constituents of the old adage that “you get what you pay for.” More net funds for our amazing missions is more meaningful in the long run than delivering less, but more efficiently. Because our missions are so important, adopting a more effective set of evaluation tools is vitally important.

Have you succeeded in altering the focus toward productivity and away from CP$R? If so, share your story.

Are you using Infographics as reporting tools? You should be.

During National Business Intelligence (BI) Month, a number of top-notch infographics have caught my eye. These handy visuals are really reports, depicting data and details germane to a topic. But, they are also much more. They provide guidance about how to use the data. They tell a story. They provide business process guidance. In short, they’re quite helpful and you should be looking into how these can help your fundraising efforts.

I should note that I know this topic is not new. Infographics have been around for years and some folks have declared them irrelevant or unhelpful. However, any visualization of information that tells the story you need told can be valuable, so infographics likely have utility in your shop.

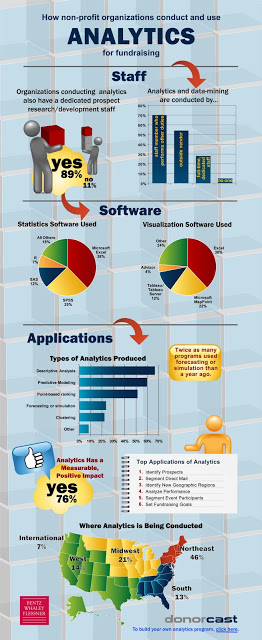
BWF Analytics Infographic

For example, our firm created a handy infographic (on the right) to present data from a survey we conducted on analytics. This image is really many reports in one. It presents the data in a logical order. In general, it is a useful guide to the topic of fundraising analytics, benchmarking for staff, and related information.

So, how should you set about creating an infographic?

  1. Determine your topic. Infographics can be great for 40,000 foot ideas as well as minutia, but generally not both.
  2. Find your data. What data do you have to display? What data would you like to go get?
  3. Lay out your story. The visual aspects of this process are important. Do you want the reader to “take it all in”, “follow along”, or just see some useful visual depictions of data and interpretation?
  4. Pick a infographic tool and get going. Many tools are out there. Check out this resource for some good and free tools.

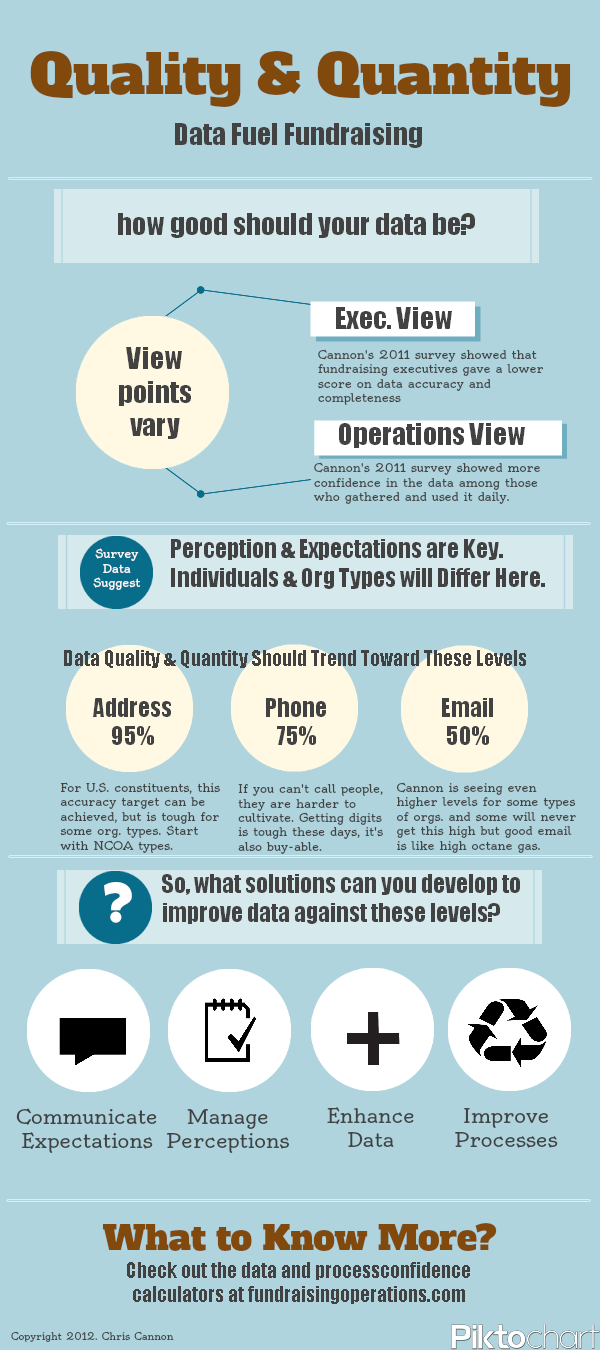
Finally, I thought I’d take some of my own advice (for a change!). Below is the inaugural fundraisingoperations.com infographic. It uses data from a survey I did for my 2011 book An Executive’s Guide to Fundraising Operations. While my effort isn’t as amazing as this awesome college football bowl game pic, I created it in 20 minutes. Have any great infographic examples? Drop your links in the comments. Happy infographic-ing!

Data Quality and Quantity, v2
This pic presents data from Cannon’s 2011 book on fundraising operations, which shows how data quality expectations and perceptions vary.

Get your grateful patient process going

It’s 2013…a lot transpired in recent months that may affect healthcare fundraising. New and different taxes. New and different healthcare provisions. New and (potentially) different court rulings. But, one this hasn’t changed: your organization must get serious about installing and leveraging an effective grateful patient program.

Great grateful patient and family programs have interrelated components–physicians and other care givers, admissions, development, and compliance folks are all in the mix. None of your internal sensitivities should be ignored, but none should be allowed to derail an effort to put a great, HIPAA-compliant process in place. We also know that some parts of a program matter more than others. In particular, physician referrals seem to make the most difference. A robust, end-to-end business process will cement the behaviors needed to capitalize on, or start to create, such referrals.

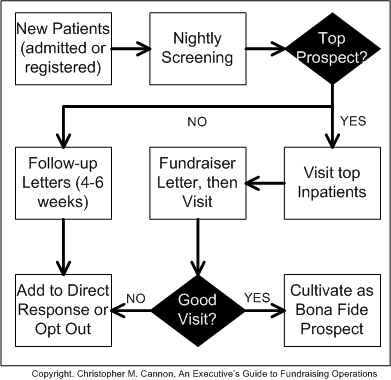
So, what does a great process look like? Much like great fundraising campaigns, details of the process will vary from organization to organization. I submit that a great process for some could be completely paper-driven and manual while others must be automated to be effective. All of them share key core process and technical components, though. The following diagram depicts each element that must be in place.

Grateful patient process

A few points about this process:

  • Patients can include outpatient and clinic visits, but you might want to start with the smaller data set of in-patients.
  • Nightly screening matters most when there is a subsequent daily review and triggers.
  • In-patient visits are permissible, but a philanthropic culture must be in place first.
  • If you don’t record and analyze the data and activity generated from the process, you are missing a big part of the process.
  • It will take time to yield big results, but some of our clients processes leverage annual giving channels to provide immediate financial benefit, and identify potential major donors.
  • There are dozens of other considerations not covered here but important to the process…so many issues, to be honest, that I joke this should be the subject of my next book.

Your team may not have the technical ability to build real-time data exchanges from the patient database to the screening company to your donor database. If API and SQL are foreign concepts, your process can still be rigorous and daily. However, automating visit ticklers, introduction letters, and other elements of the process, it is typically worth the effort. Ultimately, this business process should generate big-ticket leads while greatly expanding your solicitable constituency.

Remember that developing a business process here is the responsible thing to do. The law allows it and your organization’s competition may already be doing it. If you already have a process in place, could you make it even better? And, if you don’t have a process, now is the time to get going? Get the data, people, and processes in place and start delivering better and better prospects to support you fundraising efforts. Good luck and feel free to share any challenges or successes you’re experiencing.