Category Archives: change management

CRM Adoption: It’s not a Marathon, It’s a Triathlon

Picture this: you have a count-down clock, ticking down with single digits left. Conversion of data has been tested. Training engaged the whole team. You’re ready for go-live….except you’re not. You’re not because Go-Live is, best case, just the middle of the process. And, this is a problem because:

  • Leadership thinks the “go-live” means “project complete”.
  • Finance thinks the fiscal spigot can be turned off.
  • Field officers think they know just how to use the system.
  • A raft of reports, business process re-engineering, and other steps remain.
  • Oh, and you need to see whether the year-end procedures that work in principle will work in reality…in 9-12 months.

Expectation management that starts in #CRMSelection and carries through to #CRMImplementation must be an ongoing part of #CRMAdoption. For starters, system transitions (I often use “transition” or “replacement” to indicate that these changes are more than a conversion, etc.) have very long tails. Even though the volume of work happens in the first 1-2 years, another few years are often necessary to really refine, leverage, and optimize the new system. This means that, as one of my most contented and expert CRM clients experienced in their journey, a 5-year plan and budget is a smart way to go.

After good planning and a reasonable budget, the starting point for solid adoption is basic: great data. Trusted data, converted correctly from the old system. While this seems like a “didn’t go-live cover this” item, many of my clients find either issues for months or change their minds about data codes, locations, applications, etc. such that back-end global changes are necessary.

Reporting is often the epitome of post Go-Live pain point. It is hard for your colleagues to adopt the new database if they cannot get data outputs. My rule of thumb for any system transition is simply that “great reports mean great transitions”. Such reporting requires shared definitions, thoughtful calculations, mastery of new tools, and other benefits to long-term adoption.

Integrations with other systems present another likely post Go-Live adoption. Typically, things like the feed to Finance are ready to roll before conversion is complete.  However, often patient feeds, student feeds, parent feeds, athletics feeds, online engagement tool feeds, etc. may not be in place at Go-Live. One client recently made the mistake of going live without a functioning feed to a high-volume gift generation foundation, only to be crippled by the extra dozen+ batches of gifts to manually handle each day.

Training is another core consideration for effective adoption. For starters, Training is not a spectator sport and should extend permanently after Go-Live. Training options should be varied (in-person, desk-side, computer-based) and be paired with accurate, update documentation. New staff on-boarding should be factored in.

#CRMAdoption is more than a Marathon

Go-Live as the Middle of the Race

I’ve always been a fan of the explanatory power of metaphors and similes, especially sports metaphors. “Crossing the finish line,” “Being a good team member,” “Handing off the ball” all make complicated things clearer (for me at least). So here is a way to sum it up:

Go-Live is more like finishing the cycling leg of a triathlon. You haven’t crossed the finish line yet. The good news is you didn’t drown during #CRMSelection and now #CRMImplementation is mostly complete….but you still have a pesky marathon to run.  Adoption requires all of those items above–data, reporting, integration, training–to be successful. And, too often, organizations go live well before they were ready for it.

Many say that a conversion is a marathon and not a sprint, but to fully transition to a new system, it’s more like a triathlon.

Do you have any good CRM-related metaphors? I’d love to hear ’em. ~Chris

Mindset Impact: Beloit’s Mindset List and Your Team

Have you seen the Mindset List? Beloit College creates a list of realities for incoming freshman that help inform their faculty. It’s turned in a thing, really. It’s fun, it’s insightful, and it’s useful. For example, you may not know “1. Eminem and LL Cool J could show up at parents’ weekend.” for those in the class of 2021.

What Does this Mean for Us?

For those of us in higher education advancement, this list is a good barometer of our incoming classes. Beyond this, I wanted to see what it would tell us about advancement users–what can we learn from the Mindset List….from 2007.Beloit 2007 Mindset List

Think about it: many of our 20-something colleagues are experiencing one of their first jobs when they join our advancement teams. Their experiences are shaped by their mindset, some of which will mirror what they were like when they entered college.

So, what was the mindset of the class entering 2007? Here are a few items that may reflect on advancement operations:

  • “19. They have never been able to find the “return” key
  • 20. Computers have always fit in their backpacks.”

What does this tell us? For starters, some of our new colleagues expect today’s lingo and increasingly convenient hardware. For too many, we deal with the iPhone problem (which, not coincidentally, launched in 2007). Our consumer lives team with awesome tech and we head to the office to be told to “click the return key” in our decade old documentation while working on often outdated tech. At a minimum, we need to recognize the differences in mindsets across our colleagues.

The rest of the lists are useful, too. The 2008 list provides #44 “They have done most of their search for the right college online” tells us just how likely every new teem member is to demand web-accessible tools. The message in all of these mindset lists is clear: know your audience….and these lists will give you a look into their perceptions and realities.

N=1 isn’t a compelling case against increased funding for fundraising

Takes money to make moneyDid you happen to read the Washington Post’s article on the demise of the nonprofit Invisible Children, best known for its Kony 2012 campaign? (Check it out here) The authors posit that this single case illustrates the dangers of increasing fundraising expenses.

Not really, of course (for both the article and the facts of the nonprofit world). The article is more nuanced. Social change and policy organizations are complicated, especially those operating in Africa. For this N=1 (Invisible Children), a few significant forces (which had little to do with a surplus-based funding approach) tore the organization apart.

This single case may be an example of how a nonprofit can fail, but there is little evidence presented and no broader applicability of this piece about whether a more market-oriented funding strategy is appropriate. The article, for example, fails to mention that nonprofits tend to spend 65% or so of their budget on staff and–spoiler alert–poorly paid people don’t stick around long and often cost about a year’s salary to replace.

The loosely argued closing of the Post piece suggests that nonprofits have benefactors and not investors (which most major donors I know would challenge). As are result, nonprofits must operate on a shoe string, cow to risks over opportunities, and generally hope that their meager existence can marginally impact those benefiting from their mission. This notion is much more dangerous than better funding nonprofit operations.

It is dangerous to create an argument on an N=1 scenario. Just as the article indicates the IC may not have been quite as impactful as their messaging suggested, this piece relies too much on its own limited perspective to suggest that IC proves the dangers of better funding nonprofits. Instead, this “overhead” myth leads to the “starvation cycle” which leads to lean and under-experienced staffing which leads to more nonprofit failures than fundraising experts would care to count.

Do you have a suggestion to help the nonprofit sector build its case for better investment? I have a few tricks (for a later post) and welcome any other ideas.

3 Critical Concerns with Cost Per Dollar Raised (CP$R)

ProductivityProductivity is vitally important to nonprofits but none of us in the social sector are able to spend enough time, energy, and…well…dollars on being productive. Instead, for decades, we have been more focused on efficiency at the expense of effectiveness and impact. We stuff envelopes at night to save money, then lose overworked staff for a 5% pay increase at a nonprofit in town. Our boards embrace online innovation but funding is often on a shoestring budget. Some great studies and presentations have highlighted some of the drivers for this. After years studying this dilemma, I submit that the over-reliance on and misapplication of the “cost per dollar raised” (CP$R) metric is the clearest example of this problem. While we want to raise more, we penalize ourselves if we invest too much.

The industry needs to change and here are three critical concerns with CP$R and its sometimes negative effect our industry:

  1. Growth: Fundraising is a long-term endeavor. Expanding fundraising results takes time, consistent marketing and messaging, and investment. The current industry emphasis on CP$R diminishes the ability to weather a tough year, offset a big gift’s impact in year-over-year evaluation, or properly fund our efforts. Organizations whose strategies rightly focus on major and principal giving are particularly vulnerable to scrutiny over CP$R issues depending on the timing of a big, strategically cultivated gift.
  2. Staffing: The professionalization of fundraising is changing the math on what is reasonable for budgets. Most nonprofits will spend about 65% of their operational fundraising budget on staff and benefits. Low CP$R targets, though, mean that we may not have enough to invest once/if we get the right people on place as this mix relies heavily on the typically market-depressed salary bases provided to fundraising professionals. We might secure top talent committed to our missions, but instead we seem to experience a costly turnover rate and stunt our fundraising efforts in the process.
  3. Infrastructure: I’ve written about the “iPhone” problem–that is, people’s expectations for work-related technology and processes are shaped by their consumer experiences using tools and apps designed by the world’s biggest companies. The result is “relative deprivation”; we want from our fundraising tools what we get from our consumer products. Unfortunately, collectively, our industry simply doesn’t generate enough demand for vendors to supply tools that match our consumer experiences. Imagine if we were empowered to demand better tools that could be shown to increase our bottomline, even if we would sometimes eclipse the currently-too-low CP$R thresholds. Imagine if we could invest an extra $0.01-per-$1.00 raised or so each year as an industry. That would be a great start.

Our industry’s efficiency mantra can be overwhelming. Funders’ expectations to deliver more with less are difficult to manage. The nature of fundraising efforts, while akin to sales, is different in its non-transactional nature. Nonprofits are directed to invest less than for-profits. And, our industry’s focus on CP$R is a root cause of our challenges.

Alternatives and Additions

While CP$R is a common measure of nonprofit evaluation, there are important alternatives to CP$R. These can be taken in conjunction with costs to present a more balanced, nuanced evaluation of the effectiveness of a nonprofit.

  • Raised per Full Time Employee/Equivalent (FTE). I’ve written at length about the value of measuring “Dollars Raised per FTE.” It is a surrogate for CP$R in some ways, but it gets at a better way to position productivity and effectiveness. Study after study shows that nonprofits raising $1 million per FTE in fundraising are performing in the top quartile. Would you rather raise more by adding more people, or save money at the risk of losing people?
  • Net Gain: Imagine this scenario—you can net $10 million or $20 million in a year, but the former costs you $2 million and the latter costs you $10 million. $20 million beats $10 million, right? Not if it costs “too much” to generate. We need to be able to choose the latter but our industry, through charity watchdogs and other traditions, rewards spending less even if you provide less to your cause. There is a balance needed here. Different organization types at different stages of growth, staffing, and infrastructure require a nuanced evaluation.
  • Impact of Dollars Raised: Recent innovations by groups like GiveWell reinforce the value in looking at what was accomplished because of the funding generated by fundraising. Can more kids experience an open MRI that donors’ contributions helped fund? Can a community see a decline in diabetes because of charitably funded education efforts? These are organization-specific so don’t lend themselves to a nice, simple number, but the current reliance on CP$R too often results in overly simplistic evaluations.

Moving forward with new measures will take guts. We need to push back against the myopic focus on annual CP$R. We need to seek investment in infrastructure and technology in line with expectations of those who sit on our boards. We need to fervently battle to retain talented staff by properly funding roles. We need to clearly define the terms of the debate so definitions like “raised” retain their fundraising meaning and are not reduced to more simplistic notions defined on a general ledger. And, most importantly, we need a message that reminds our constituents of the old adage that “you get what you pay for.” More net funds for our amazing missions is more meaningful in the long run than delivering less, but more efficiently. Because our missions are so important, adopting a more effective set of evaluation tools is vitally important.

Have you succeeded in altering the focus toward productivity and away from CP$R? If so, share your story.

Are you using Infographics as reporting tools? You should be.

During National Business Intelligence (BI) Month, a number of top-notch infographics have caught my eye. These handy visuals are really reports, depicting data and details germane to a topic. But, they are also much more. They provide guidance about how to use the data. They tell a story. They provide business process guidance. In short, they’re quite helpful and you should be looking into how these can help your fundraising efforts.

I should note that I know this topic is not new. Infographics have been around for years and some folks have declared them irrelevant or unhelpful. However, any visualization of information that tells the story you need told can be valuable, so infographics likely have utility in your shop.

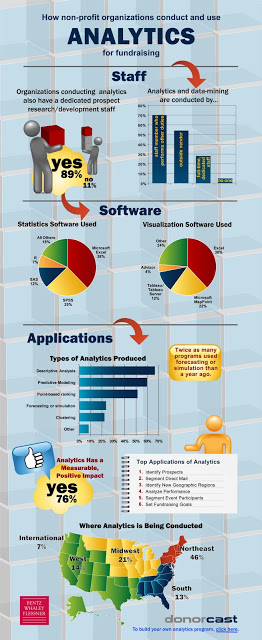
BWF Analytics Infographic

For example, our firm created a handy infographic (on the right) to present data from a survey we conducted on analytics. This image is really many reports in one. It presents the data in a logical order. In general, it is a useful guide to the topic of fundraising analytics, benchmarking for staff, and related information.

So, how should you set about creating an infographic?

  1. Determine your topic. Infographics can be great for 40,000 foot ideas as well as minutia, but generally not both.
  2. Find your data. What data do you have to display? What data would you like to go get?
  3. Lay out your story. The visual aspects of this process are important. Do you want the reader to “take it all in”, “follow along”, or just see some useful visual depictions of data and interpretation?
  4. Pick a infographic tool and get going. Many tools are out there. Check out this resource for some good and free tools.

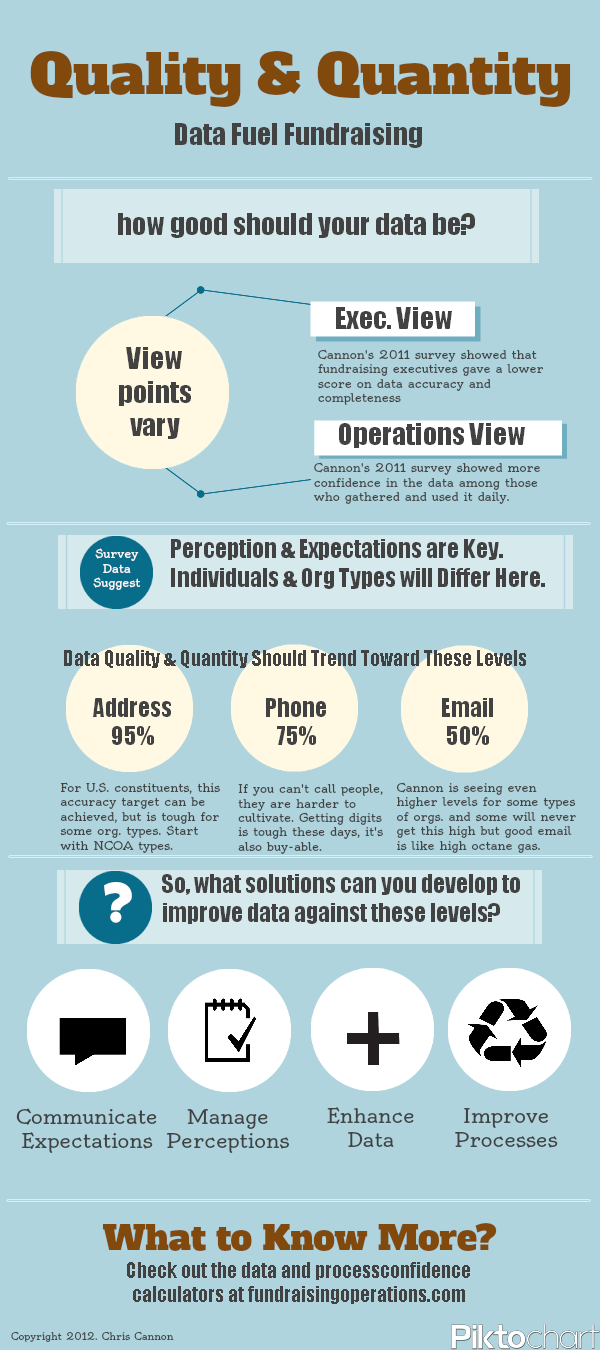
Finally, I thought I’d take some of my own advice (for a change!). Below is the inaugural fundraisingoperations.com infographic. It uses data from a survey I did for my 2011 book An Executive’s Guide to Fundraising Operations. While my effort isn’t as amazing as this awesome college football bowl game pic, I created it in 20 minutes. Have any great infographic examples? Drop your links in the comments. Happy infographic-ing!

Data Quality and Quantity, v2
This pic presents data from Cannon’s 2011 book on fundraising operations, which shows how data quality expectations and perceptions vary.

January is National Business Intelligence Month…

…didn’t you know that? Of course you didn’t. With the holidays, closing some year-end gifts (not to mention the books), and learning an awful lot about Amazon’s post-holiday online return policy, how could you keep up with all of the information being thrown at you. It’s hard enough to have the right information, much less use it effectively. Plus, it’s not really National Business Intelligence Month. I made that part up.

So, why the subterfuge? We need to draw attention to the critical need in the advancement business for more and better reporting and analysis. Some of you already have what you need. Some stopped looking years ago. Some have that “special” report that some poor person spends hours to prepare. But, most of us want better reporting, the kind that actually helps us make decisions about the business and tells us things we otherwise wouldn’t have known.

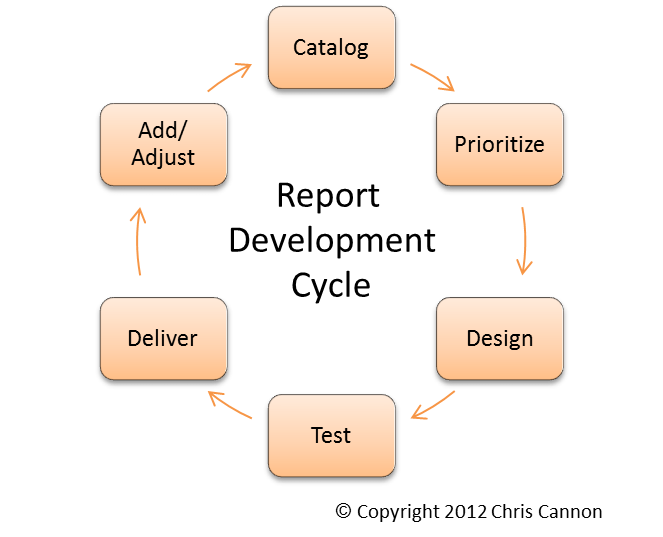
Better reporting requires a few things. This flow chart shows the way to better reporting. But, even more important than creating reporting is turning it into business intelligence.

Report Development Cycle

Let’s work to get even better data into even more clear reports that drives even better decisions. Let’s stop with the ad hoc, don’t-really-learn-much urgent reporting and develop a thoughtful suite of reporting that allows you to direct the team. Let’s develop shared definitions and expectations, allowing our reports to mean the same thing no matter the audience. So, know that I think about it, let’s make January National Business Intelligence Month. Make sure to put it on your calendar for next year.

December 2012 is National Month Month…

…or so I tweeted a few weeks ago. My plan is to envelope the work we lovingly call fundraising operations, or advancement services, or “the back office”, or “you know, that stuff they do with computers” into 12, neat monthly categories. The purpose is to drawn attention to whole sets of work that we sometimes avoid but can never quite escape (I’ve tried).

So, for those of us so fortunate to be toiling away the day after December 25th, what “National _____ Month” would you designate and why?

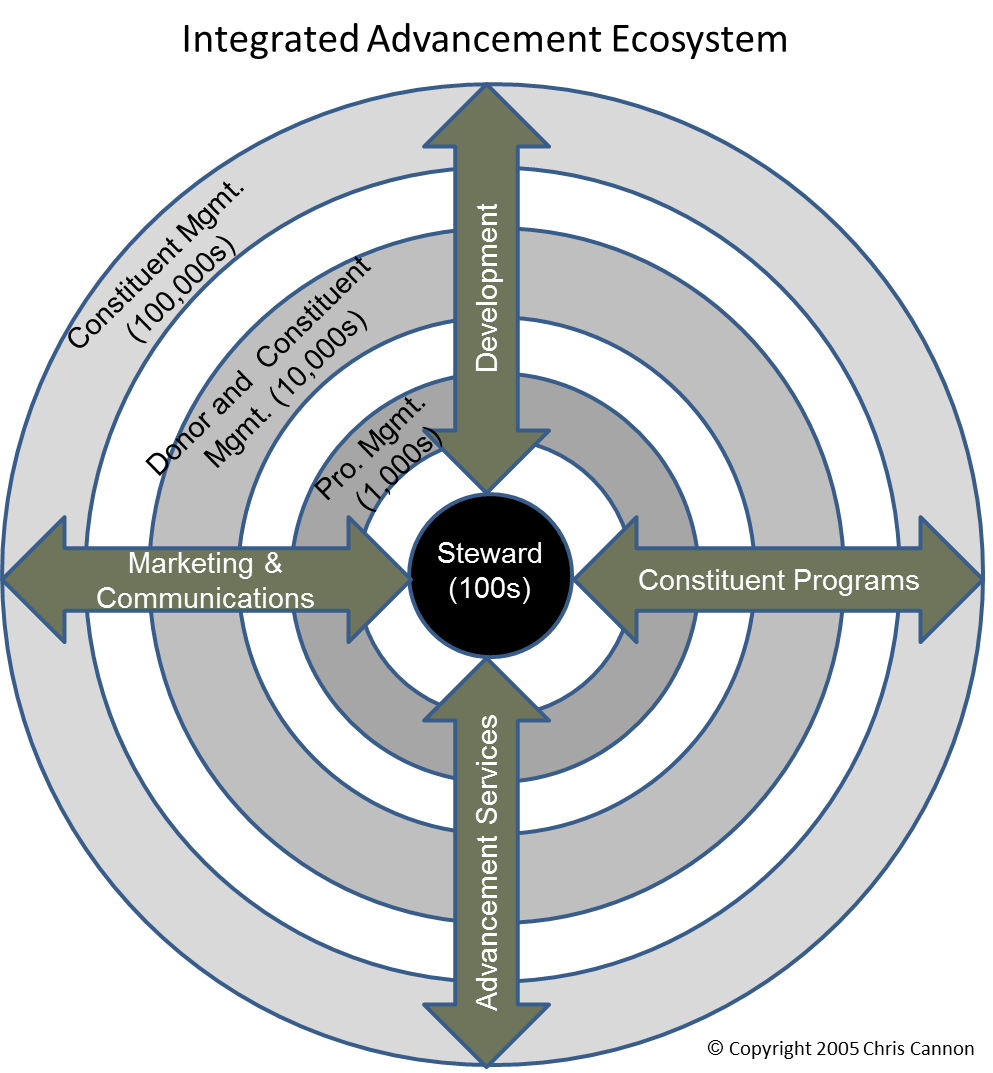
Integrated Advancement Ecosystem idea

Years ago, I created this image and phrase “integrated advancement ecosystem.” It guides my thinking, and I’ll be building on and detailing the concepts in this framework in the months to come. Some of the components are called different things by different (types of) organizations. For example, “constituent programs” for a university are generally “alumni relations” whereas in healthcare, perhaps it’s “community relations.” I welcome your ideas about it.

Cannon's Integrated Advancement Ecosystem

The Purpose of the (Gift) Process

Log jam
Are gifts and data updates piling up?

“Tis the season…for bottlenecks and backlogs in our processes. Fundraising operations requires consistent, efficient processes. But, fundraising is an inconsistent business. We are in the business of the exceptional, as was the focus of my 99-1 blog a few months back.

As we approach year-end with (hopefully!!) piles and piles of gifts to process, let’s remember four essential ideas:

  1. The purpose of gift processing is first and foremost stewardship.
  2. The reason we (should) love fundraising is because our teamwork can generate a sometimes overwhelming volume of gifts.
  3. Our business process should be efficient ( doing “the thing right”) and effective (doing “the right thing”).
  4. We must adopt a front-of-the-line approach to ensure that our most cherished donors receive the level of stewardship they deserve for their role in our 2012 success.

Having your team abide by these four essential ideas will ensure that we don’s lose track of why we’re so busy in the first place. Good luck!

Change is Hard…but Decline is Worse

Development and alumni organizations face obstacles and challenges each day. It seems that pressure comes from all sides and angles. Raise more money, despite a slow economy. Engage more people, despite increasing competition for space in people’s lives. Lately, two core changes have been impacting nonprofits around the country: leadership changes and technology issues. Both of these affect fundraising operations, and finding a way to “handle” these issues is critical. On the leadership front, high functioning presidents and vice presidents are in high demand. Tenures of university presidents and healthcare CEO’s declining. There’s not much most can do to stop this slide, except to be prepared for it to happen. On the technology front, 2012 was full of mergers and other changes that substantially impact development technology suites. Much of this change is aligning with the tail-end of many product life cycles. These changes affect every nonprofit for a donor database, so one of these days these marketplace changes will affect each organization. More change is stemming from social, online, and BI-based innovations occurring at a pace that’s hard to match. The most dangerous aspect of the core changes is the all-too-frequent dip in productivity organizations experience “as a result of” the change. This issue is in quotes because, while leadership and technology change is hard to “manage” (we typically don’t have much control), these changes can be anticipated and protected against. The good news is that both of these changes can be managed through a similar set of solutions which will keep decline at bay in the midst of change:

  1. Plan the work. A plan that aligns with the organization’s mission and vision will help ride out the turbulence from a big leadership or technology change. You might be surprised at how effective a good plan is in keeping the trains running on time.
  2. Work the plan. The plan should have measurable targets for behavior. Great plans will reward and steer attention to the highest value activities we can muster. So, if the plan is in place, working it should generate the results your organization needs, despite a presidential transition or a looming conversion.
  3. Avoid the tyranny of the urgent. In both cases, careful change management (starting with requirements, weighing options, evaluating real and intangible costs) must prevail over short-term thinking and flailing actions. Plus, reminding folks about what’s important in their daily work and the impact their role has on the organization’s constituents can help retain staff despite rough patches.
  4. Get in front of disruptive change. This last issue is the most complicated and I’ve dedicated a separate blog to it. Leadership and technology changes are disruptive, often resulting in entirely new ways of doing business. We have seen in 2012 with Hostess, and over and over again for Kodak, that markets move on, and our offerings must match today’s and tomorrow’s needs. As fundraising tactics shirt around direct response, as phonable and mailable constituents decline, as the nature of our organization’s missions and deliverables change (think MIT’s free open courseware offerings and the impact of the Affordable Care Act on healthcare philanthropy), our fundraising strategies and tactics must keep pace.

And, if we plan the work, work the plan, and remain focused on the important, we can get through change without a dip n productivity. Do you have suggestions for handling change and avoiding declines in the process? Let’s hear about them!