Category Archives: Business Intelligence and Reporting

Advancement technology satisfaction survey

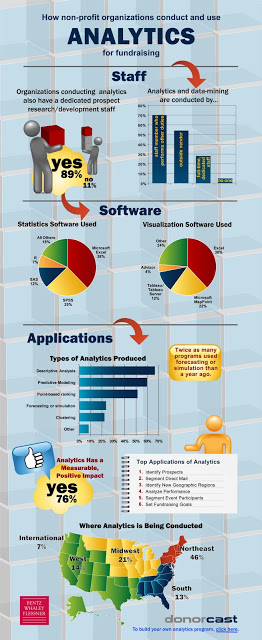
Zuri Group and EverTrue recently conducted a thorough survey of advancement users’ satisfaction with their systems. The central finding was that users are unimpressed with their resources. Dissatisfaction with databases, reporting tools, analytics resources, and other important fundraising tools was often 40% or more. And, the typical response for nearly all of the questions was “it’s ok”, which means that “Meh” is the average sentiment among our users. You can check out the report here: The Advancement Technology Landscape 2017 – EverTrue and Zuri Group

Here’s a sample of the report that highlights the challenges faced by our advancement technology environments:

Advancement technology satisfaction
Reporting, a central solution for advancement programs, is failing to meet demands.

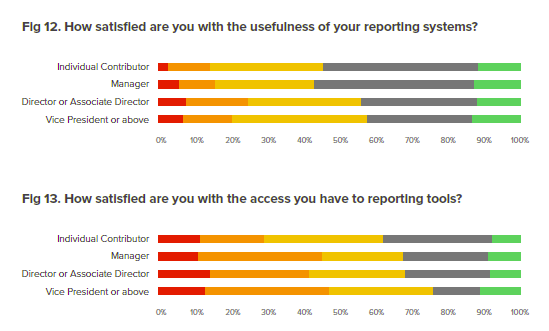
The trend for the survey suggests that “common” issues (like gift processing) received better satisfaction scores whereas more innovative and new areas, such as social data management (which only a few companies, like EverTrue, really address) and analytics, received lower satisfaction scores. Some of this may simply be the typically slow technology adoption our industry experiences. However, it is important to move beyond the “we don’t have the money/time” argument and start to examine the roots of these issues and how your institution can begin to improve satisfaction.  Our users clearly want more and better solutions.


There are some solutions and some ongoing obstacles to improving the advancement technology landscape. To solve the issue, non-technical tactics like building trust and negotiating expectations are more important than you might think. Delivering on the fundamentals–accurate, complete and timely data–and adopting a PR-style, metrics-driven strategic information management approach will gain some favorable survey points. However, the lack of funding for, and innovative technical solutions to, fundraising applications remain pretty substantial problems. Thus, expectation management will be a critical component of your effectiveness.

What is your team experiencing? How have you improved user satisfaction at your institution? Share your best tips and tricks to help tackle this ongoing challenge.


Prospecting, Analytics and Data for Gift Planning

The St. Louis Planned Giving Council was a terrific setting to discuss changes (and continuations) in prospect development. The group discussed what’s the same, what’s new, what’s working and what’s on the horizon.

You can find my presentation on the topic here: SLPGC – Prospecting Discussion, November 2014.

Best of luck with your fundraising initiatives as year end approaches.


3 Analytics Challenges: Context, Endogeneity and Spurious Results

Donor Analytics ContextAn interesting visual depiction of spurious correlation (check it out here) reminded me of my grad school days and the rigor with which I would build hypotheses. Rather than let R, SPSS, or Excel correlate away and then proclaim some amazing finding, I started from the reasons and results I expected to validate with data. The difference is, all too often, that the former approach tells you very little due to endogeneity, spurious results, and the lack of context.

Some organizations–Google is known for this–will say “don’t worry about the why”. Some have referred to this approach as “theory-free“, a nice euphemism to indicate how little long-term value we might find in these correlations. Now, for consumer behavior where Big Data is truly present  perhaps this works. But, data points are rarely available for nonprofit analytics in the same way as, say, Target and Wal-Mart have data…although there are new options underway, like David Lawson’s newsci.co.

And, if you talk with a gift officer who’s been disappointed with predictive modeling results, you see a different picture. From that vantage point, the analytics results are frequently devoid of context. The result confirm what we already knew (“these prospects look rich! they live in a nice neighborhood!”) or reflect a pattern we already see (“they gave last year! let’s ask them again!”). Yet, modeling doesn’t typically improve relationships with prospects.

A big culprit: Context. Donor context is critical in building relationships. And, context is quite challenging to incorporate into modeling. The following are real examples of discussions about potential prospects surfaced by a context-free model:

  • “Sure, Jane looks promising, but we don’t have a phone number to reach her and no volunteer connection, so how likely is it she’s approachable?”
  • “Absolutely, Ed looks great, but did you know he just filed for divorce?”

The solution to this issue isn’t to cast off analytics. It’s to improve it. Start with and add in theory. Guard against spurious results. Don’t elevate an endogenous variable as meaningful. And, most of all, our industry needs resources that can actually add context to results. As a student of philanthropy, I am anxiously awaiting the time when our new science of analytics better delivers on the hype and improves our understanding of donor behaviors, while avoiding endogeneity and spurious results.

Are you using Infographics as reporting tools? You should be.

During National Business Intelligence (BI) Month, a number of top-notch infographics have caught my eye. These handy visuals are really reports, depicting data and details germane to a topic. But, they are also much more. They provide guidance about how to use the data. They tell a story. They provide business process guidance. In short, they’re quite helpful and you should be looking into how these can help your fundraising efforts.

I should note that I know this topic is not new. Infographics have been around for years and some folks have declared them irrelevant or unhelpful. However, any visualization of information that tells the story you need told can be valuable, so infographics likely have utility in your shop.

BWF Analytics Infographic

For example, our firm created a handy infographic (on the right) to present data from a survey we conducted on analytics. This image is really many reports in one. It presents the data in a logical order. In general, it is a useful guide to the topic of fundraising analytics, benchmarking for staff, and related information.

So, how should you set about creating an infographic?

  1. Determine your topic. Infographics can be great for 40,000 foot ideas as well as minutia, but generally not both.
  2. Find your data. What data do you have to display? What data would you like to go get?
  3. Lay out your story. The visual aspects of this process are important. Do you want the reader to “take it all in”, “follow along”, or just see some useful visual depictions of data and interpretation?
  4. Pick a infographic tool and get going. Many tools are out there. Check out this resource for some good and free tools.

Finally, I thought I’d take some of my own advice (for a change!). Below is the inaugural fundraisingoperations.com infographic. It uses data from a survey I did for my 2011 book An Executive’s Guide to Fundraising Operations. While my effort isn’t as amazing as this awesome college football bowl game pic, I created it in 20 minutes. Have any great infographic examples? Drop your links in the comments. Happy infographic-ing!

Data Quality and Quantity, v2
This pic presents data from Cannon’s 2011 book on fundraising operations, which shows how data quality expectations and perceptions vary.

Get your grateful patient process going

It’s 2013…a lot transpired in recent months that may affect healthcare fundraising. New and different taxes. New and different healthcare provisions. New and (potentially) different court rulings. But, one this hasn’t changed: your organization must get serious about installing and leveraging an effective grateful patient program.

Great grateful patient and family programs have interrelated components–physicians and other care givers, admissions, development, and compliance folks are all in the mix. None of your internal sensitivities should be ignored, but none should be allowed to derail an effort to put a great, HIPAA-compliant process in place. We also know that some parts of a program matter more than others. In particular, physician referrals seem to make the most difference. A robust, end-to-end business process will cement the behaviors needed to capitalize on, or start to create, such referrals.

So, what does a great process look like? Much like great fundraising campaigns, details of the process will vary from organization to organization. I submit that a great process for some could be completely paper-driven and manual while others must be automated to be effective. All of them share key core process and technical components, though. The following diagram depicts each element that must be in place.

Grateful patient process

A few points about this process:

  • Patients can include outpatient and clinic visits, but you might want to start with the smaller data set of in-patients.
  • Nightly screening matters most when there is a subsequent daily review and triggers.
  • In-patient visits are permissible, but a philanthropic culture must be in place first.
  • If you don’t record and analyze the data and activity generated from the process, you are missing a big part of the process.
  • It will take time to yield big results, but some of our clients processes leverage annual giving channels to provide immediate financial benefit, and identify potential major donors.
  • There are dozens of other considerations not covered here but important to the process…so many issues, to be honest, that I joke this should be the subject of my next book.

Your team may not have the technical ability to build real-time data exchanges from the patient database to the screening company to your donor database. If API and SQL are foreign concepts, your process can still be rigorous and daily. However, automating visit ticklers, introduction letters, and other elements of the process, it is typically worth the effort. Ultimately, this business process should generate big-ticket leads while greatly expanding your solicitable constituency.

Remember that developing a business process here is the responsible thing to do. The law allows it and your organization’s competition may already be doing it. If you already have a process in place, could you make it even better? And, if you don’t have a process, now is the time to get going? Get the data, people, and processes in place and start delivering better and better prospects to support you fundraising efforts. Good luck and feel free to share any challenges or successes you’re experiencing.

January is National Business Intelligence Month…

…didn’t you know that? Of course you didn’t. With the holidays, closing some year-end gifts (not to mention the books), and learning an awful lot about Amazon’s post-holiday online return policy, how could you keep up with all of the information being thrown at you. It’s hard enough to have the right information, much less use it effectively. Plus, it’s not really National Business Intelligence Month. I made that part up.

So, why the subterfuge? We need to draw attention to the critical need in the advancement business for more and better reporting and analysis. Some of you already have what you need. Some stopped looking years ago. Some have that “special” report that some poor person spends hours to prepare. But, most of us want better reporting, the kind that actually helps us make decisions about the business and tells us things we otherwise wouldn’t have known.

Better reporting requires a few things. This flow chart shows the way to better reporting. But, even more important than creating reporting is turning it into business intelligence.

Report Development Cycle

Let’s work to get even better data into even more clear reports that drives even better decisions. Let’s stop with the ad hoc, don’t-really-learn-much urgent reporting and develop a thoughtful suite of reporting that allows you to direct the team. Let’s develop shared definitions and expectations, allowing our reports to mean the same thing no matter the audience. So, know that I think about it, let’s make January National Business Intelligence Month. Make sure to put it on your calendar for next year.

December 2012 is National Month Month…

…or so I tweeted a few weeks ago. My plan is to envelope the work we lovingly call fundraising operations, or advancement services, or “the back office”, or “you know, that stuff they do with computers” into 12, neat monthly categories. The purpose is to drawn attention to whole sets of work that we sometimes avoid but can never quite escape (I’ve tried).

So, for those of us so fortunate to be toiling away the day after December 25th, what “National _____ Month” would you designate and why?